Multidimensional Analysis allows you to export filtered data from the ACADEM database for analysis.
Three functions are available in this menu:
- Analysis of intellectual contributions
- Analysis of teacher qualifications
- Ad’Hoc Reporting
Analyses of intellectual contributions and faculty qualifications enable these data to be filtered, and give direct access to their modification.
Ad’Hoc Reporting allows you to create data models, using joins between several tables to combine their data in an unique export.
This article is about Ad’Hoc Reporting.
See the articles below for :
➡️Analyse intellectual contributions
➡️Analyse faculty member’s qualifications
Ad’hoc Reporting can be used to query the ACADEM data template and create various reports that can be exported in Excel format.
Create a data template
To create a new report, the user must first define a data template: to do this, select the various data tables linked in ACADEM, and the various fields to be queried.
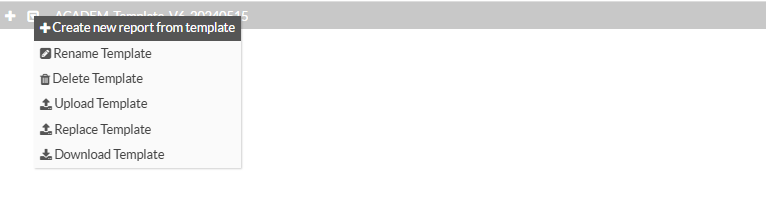
From the ‘data models’ sub-heading: click on the + icon to create a new report from the model.
By clicking on the small arrow next to the +, several options are proposed: Create new report from template, Rename template, Delete template.
The last three options – Upload template, Replace template or Download template – concern the loading and modification of reports with custom fields. ℹ️Contact our Rimaone team to use them.
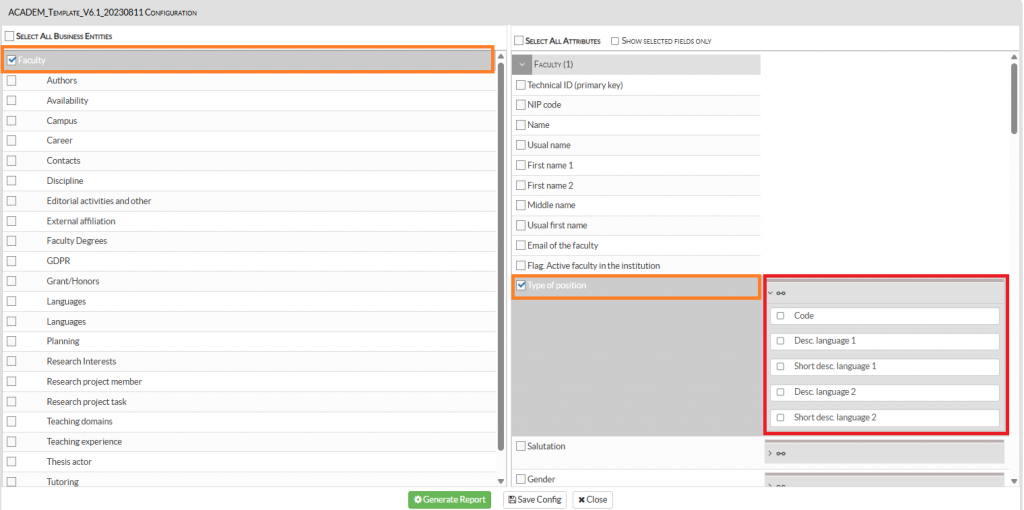
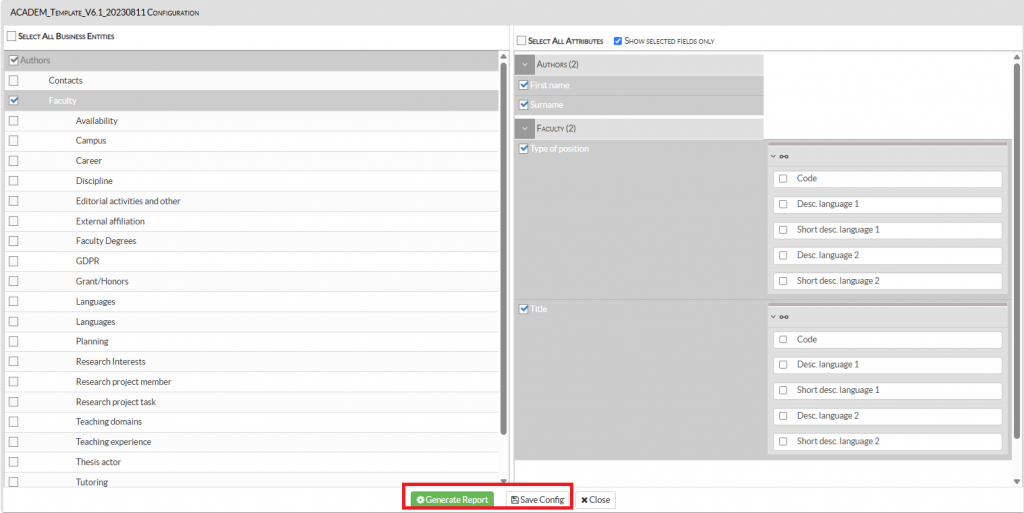
The template creation window is divided into two parts:
- Entity selection: these are the data tables present in the ACADEM database.
- Attribute selection: these are the fields that make up the data tables selected as entities.
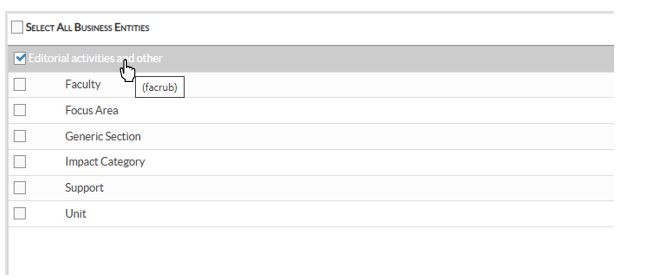
ℹ️The technical name of each label (entity or attribute) can be displayed in the form of a tooltip when you move your mouse over it.
Right-click on the entities section to see the names of the data tables displayed. Right-click on the attributes to see the field names.
Selecting an entity allows you to :
- Display a list of its attributes. User chooses which of the attributes will be the fields of the future report.
- Select any other entities (or data tables) linked by a join.
The selection of other entities depends on the first entity selected: only tables linked to the first entity can be added to build the query.
For example: by selecting the Thesis Actors entity, you can simultaneously select Contacts, Faculty, Thesis and Units entities, which are linked.
User can thus select and mix the attributes proposed for each entity selected, in order to create a single report.
ℹ️When selected, some attributes are followed by a drop-down list on the right of the screen.
This configuration concerns attributes that are part of referential tables: it is then possible to choose to display the value by its code, or one of its labels entered in the referential table.
When all the elements of the query have been selected :
- The template can be saved before generating the report, so that it can be used again later for future queries: click on the Save config button.
- The report can be generated directly, if it was an exceptional and unique request.
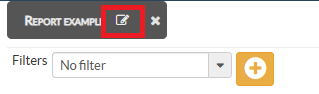
The template can then be modified and/or saved by clicking on the pen icon in the tab at the top left of the generated report.
ℹ️For each entity selected, at least one attribute must be ticked in order to generate the report or save the template. Otherwise, the two buttons cannot be accessed.
ℹ️Use the ‘Show selected fields only’ box to check which attributes are being requested.
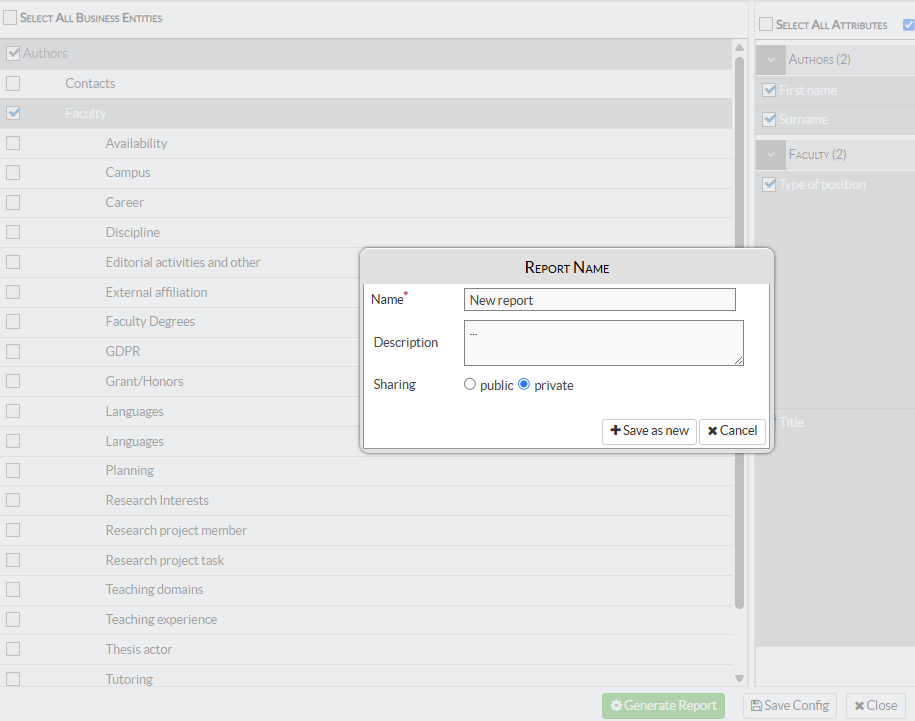
By saving the template, you name the template and write a description to indicate what it contains or to explain the purpose of the report.
By default, template sharing is private. Only the user who created it can view, use or modify it.
Otherwise, the template can be shared with all ACADEM users who have access to the Ad’Hoc Reporting menu (DA, DA_RO or ENTITY_MGR roles), by checking the public sharing option.
Consult a generated report
Once the query template has been configured, click on the green Generate Report button to view the queried data in a spreadsheet.
⚠️ The number of rows that can be generated in the report is limited to 10,000.
The report is first generated in an on-screen spreadsheet, with one column for each field (attribute) requested.
The user can act directly on the columns in the report:
- By clicking on the column header: the data in the columns can be sorted in ascending or descending alphabetical order.
- By right-clicking on the column heading: the column can be hidden, redisplayed or its data filtered.
- The order of the columns can be changed by selecting the column header and moving it with the mouse.
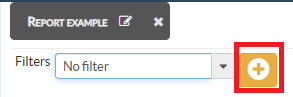
Filters or customised sorting can also be used to make it easier to read/analyse the report generated on screen. Click on the yellow + button to create one or more filters/sorts to be applied.
FILTERS allow you to make a more precise query in the report: for example, ‘I only want to see teachers with an AACSB PA qualification in the generated data set.’
The SORT tab is used to sort the values in one or more columns upwards or downwards. Select the column to be sorted, and choose the type of sort – ascending or descending – to be applied to the values in the column.
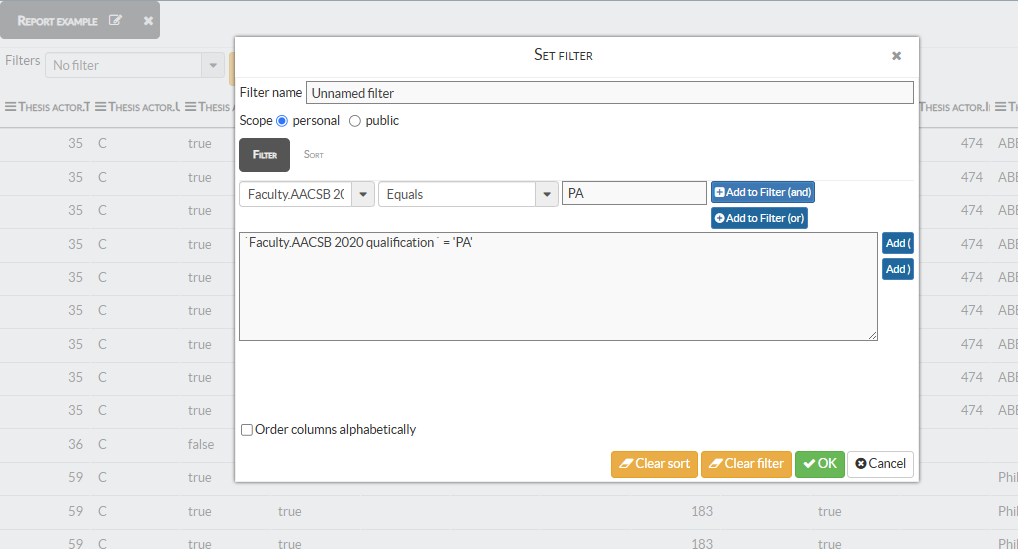
These filters are saved so that they can be reapplied to the same report in the future.
By default, their scope is ‘personal’: they are therefore available only to the user who creates them. But they can also be shared with other users who might generate the same report.
The values queried in the report are the current values on the ACADEM screens at the time of the query. It is possible to refresh them if the data has changed, by clicking on the yellow button on the left of the screen.

Modify/delete a saved report
The list of saved reports can be accessed from the Reports list tab.
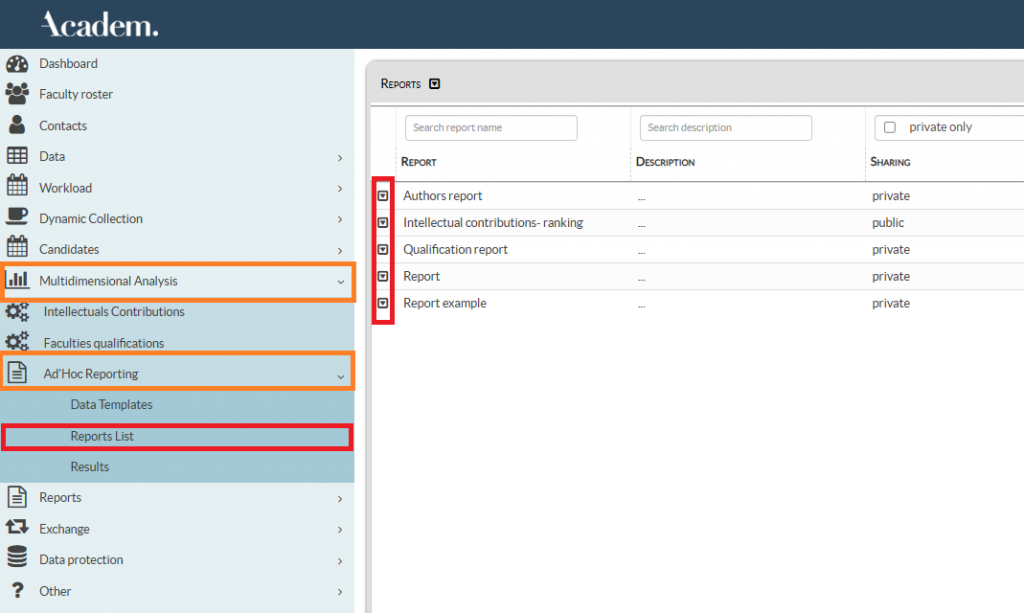
Click on the arrow icon to the left of the report name to access the various possible actions (you can also right-click on the report name to access the actions):
- Run/Execute the report,
- Edit the report query,
- Rename the template,
- Delete the template
- Or share the report: if the report template has been saved as private, it can be made public.
Export the generated report
Click on the download icon at the bottom left of the page to export the generated report in Excel format.
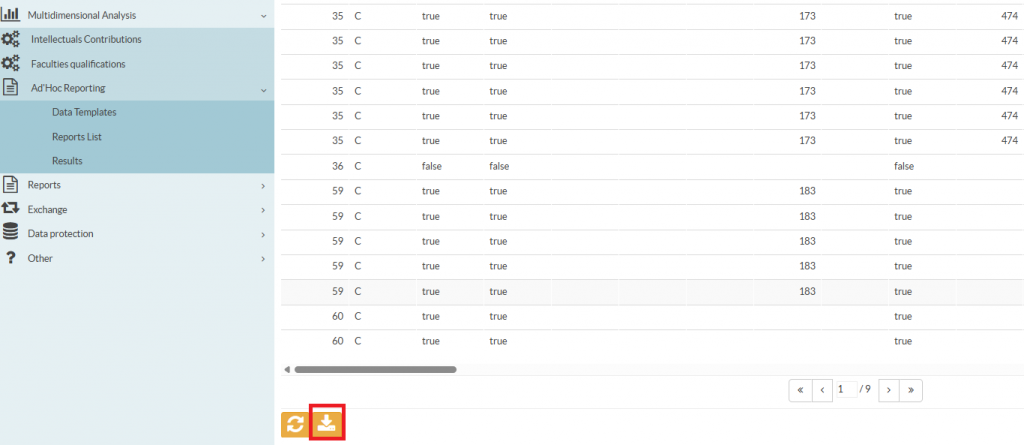
ℹ️The export to Excel format takes into account the filters and sorting applied to the report generated on the screen.